This blog is about how the world stock markets perform and which way they will take next.I have developed my own technical tools during 30 years to give the investor early warnings for coming big changes in the main trends and for the trader to take positions before the markets react. Click all charts.
30/09/2013
SP500 day, 2 hr bar and dot and 1 hr 03:39. The index has opened Monday as expected with the price even below the day rising 21 MA. The three hourly trends are strongly down with the 1 hr falling 200, 100, 50, 21 and 8 MA all down.. Most important is the drop below important support at 689. But here is a big gap which has to be closed. Very interesting day.
29/09/2013
All things considered
SP500, DOW, FTSE, DAX and SWED now have their 8 day MA:s down but the 21 MA:s are still rising. The 2 hr trends are down. Monday the 8 MA:s will get steeper down and the 21 MA still up giving support but can be broken and closed below.
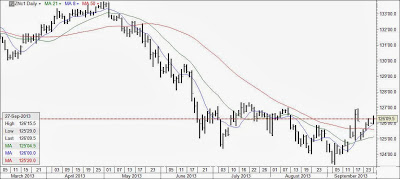
FTSE which use to lead the market in big trend changes - now have a cross on the WEEKLY chart on downside with both the 8 and 21 MA:s falling from opening Monday at 02:00. This could be the first big technical sign of a bear market. The tops in NIK and HSI are ready to start falling soon as it looks now. SWED use to go together with FTSE and here is the only sign a downtrend on 2 hr chart that could reach break down line soon. See chart. DAX long sideways daily trend will get it's 8 MA turn down at opening Monday. The first weak sign from the strongest index.
SP500 and the DOW looks the same with strongly falling 8 MA:s from opening at Monday 00.00 but also strongly rising 21 MA:s. Dow got support from 21 MA and closed above. FTSE broke the rising 21 MA and closed below. Remember that the 8 MA always is stronger and leads the way and any other rising MA have to obey the 8 MA and how it goes. This is the case in all types of charts no matter monthly or minute chart. To get an continued uptrend or downtrend there must always be a cross because the price will otherwise very often get back above a rising 21 MA.
Friday trading was thin and concentrating on US Congress budget which will be followed again Monday. It is crucial today when the senate gets the last bill from the house to vote on. Most analysts are pessimistic which can affect prices negatively already at opening. In fact it could be very ugly later when the senate votes.
Friday I said we - the trading group - would short the indexes and they did. They sold FTSE and SWED at Fridays tops.
Subscribe to:
Comments (Atom)


