29/08/2014

SP500 day close Aug 29, 2014

Day


2 hr

SP500 14:49

1 hr


15 min


5 min. WATCH UP. This break can be the start of a bigger drop

SP500 2 hr 14:38. To me it looks like the beginning of a double top

2 hr

SWED 2 hr 13:45

2 hr

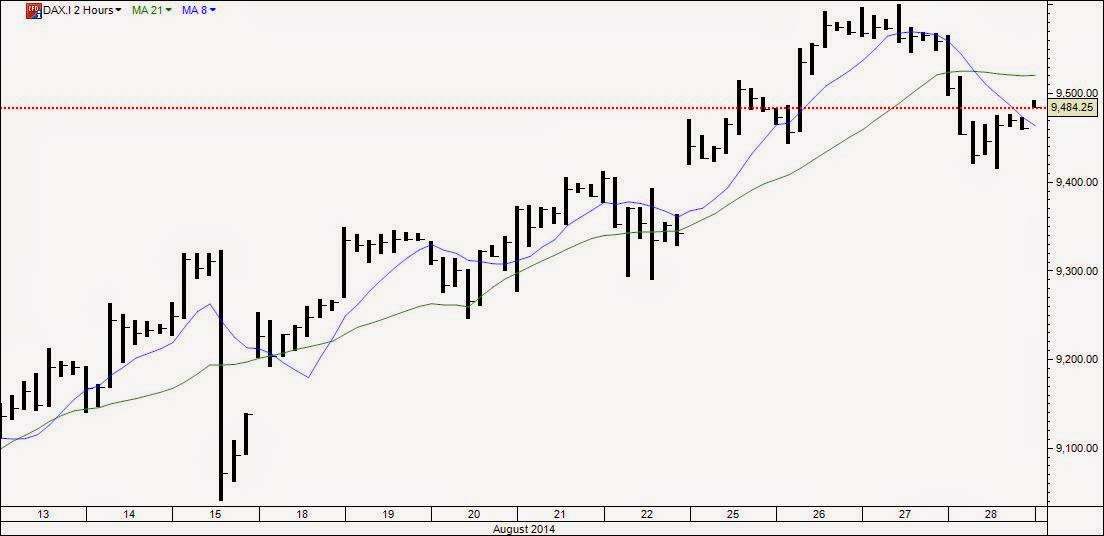
DAX. 2 hr and 5 min chart 13:35 shows the way in detail for the eventual bear market below in the day chart.

2 hr line. The trend is down and soon the 21 MA will get steeper on downside.The strong R line held perfectly but could be tested again.


2 hr zoom.


5 min

DAX day, the most important chart for the Euro countries.

Day. Here will be decided if a bear market will start or not. See the strongly falling 50 MA which has crossed the 100 MA and now only are days from crossing the 200 MA. That cross - if it comes - is the classical sign for bear market.

SP500 2 hr and 15 min 12:39

2 hr


15 min

DOW new daily high. Time now 11:16

Day


2 hr

SP500 has taken a new ATH at 2004.95. Time now 11:12

Day


2 hr

NAS new ATH at 4085.16

Day


2 hr

SP500 2 hr 09:34

2 hr

FTSE day and 2 hr after opening in London 09:00. Now 09:30

Day


2 hr

SWED day and 2 hr 09:25.

Day


2 hr

SP500 2 hr chart is working again. 09:07.

2 hr

SP500 1 hr 08:47.

1 hr dot. Holding below the first waves bottom from the top and 8 MA has turned sideways. It also has a gap since opening. Difficult to forecast now


1 hr

10 yr month still locked between 8 and 21 MA

Month

GOLD day

Day. Holding within triangle

EURO day 08:33

Day

SP500 1 hr 08:26

1 hr

NAS day and 30 min 08:19

Day


30 min

FTSE day and 2 hr 08:16

Day


2 hr

DOW day and 2 hr 08:12

Day


2 hr

DAX day and 2 hr 08:07

Day


2 hr

SP500 day and 2 hr 08:04

Day


2 hr

HSI and NIK day 07:46

HSI


NIK

NAS day and 2 hr 00:31.

Day


2 hr

DOW day and 2 hr 00:26. Will this become a double top or a new high?

Day


2 hr

SP500 day and 2 hr 00:22

Day


2 hr