
30/06/2014


SWED 14:24 The trend is down but must get below the break down line to keep the down trend.


DAX 14:09


DOW 2 hr 14:44. Dow's trend differ from SP500 and NAS. It is much weaker and is now in a very important technical situation which you can see in the 2 hr char.

DOW day 13:21.


28/06/2014
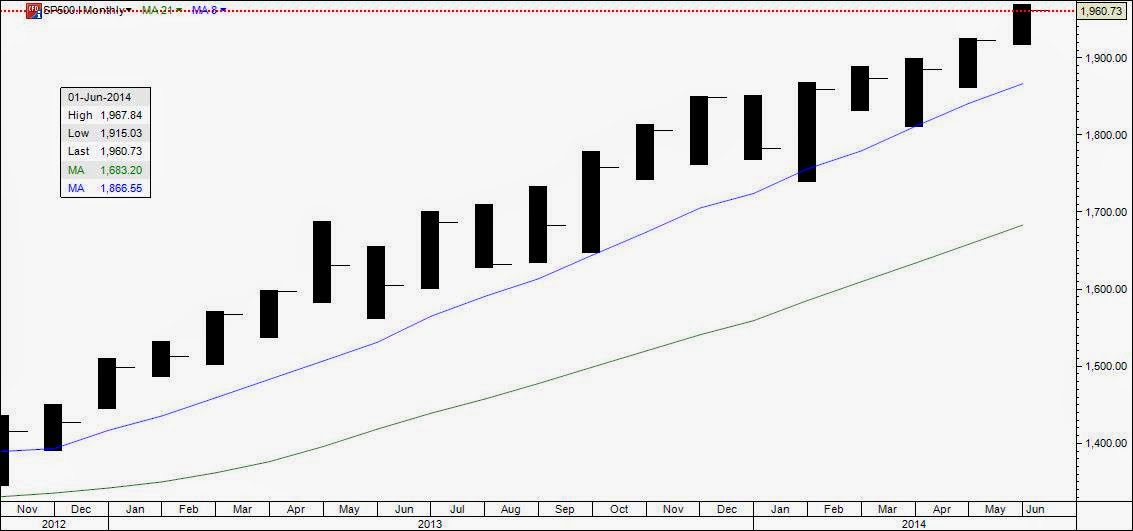
SP500 Friday close.See the strong long term uptrend .


27/06/2014


Subscribe to:
Posts (Atom)