29/06/2013

Outlook for the second half of 2013

The stock indexes I follow, DOW, SP500, FTSE, DAX and SWED are topping out now but there is not yet a definitive sell signal for current uptrend that started 2009. All these indexes will go together and the leader will as usual be FTSE and SWED. These two indexes are very close to a definite sell signal which means the tops have already been seen. The June close shows that the weekly trends soon will get a definite bear signal  for FTSE and SWED. When that is in I believe that DAX, DOW and SP500 will soon follow. There is a chance for the DOW to take a new high around 16.000 in a quick and strong rally. If this happens that rally top should be the best opportunity we can get to take long term short positions. When that top is reached a bear market will take the DOW about 63 percent lower within  3 years.

July and eventually August will show if the tops have been seen or not. All my technical instruments and my fundamental analysis now points in the same direction that after an eventual new top the indexes will fall in the biggest bear market we have seen since the late 1920's. The only way to make a big long term profit is to learn now how you short the markets. I have told you about a few of my readers who still are holding short positions sold at SP500 1.685. The highest top was 1.687.

Since the bond markets in the US has got a monthly cross on downside and yield on the 10 year treasury notes are up one percent in the first down wave every bondholder now knows the risk of holding bonds. There is a possibility that the high on all stock indexes has been seen. The coming 3 to 8 weeks is what I expect now to be the time for the definite prognosis.

28/06/2013

SP500 Friday close at 603. New month, week and day starts Monday. The trend will likely open down. A very exiting trading day. HAPPY HALF YEAR!!!

SP500 month


SP500 week


SP500 day dot


SP500 day bar


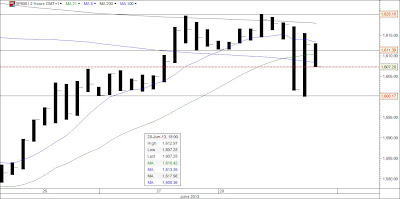
SP500 2 hr 

SP500 trend is down in the 30 min chart now

SP500 30 min 21:18

SP500 30 min chart. 8 MA turn down before crossing 21 MA which could mean a test of today's low.


SP500 has closed above 613 at 20:00. Technically today's top could be tested at 620.

SP500 5 min 20:09

DOW day and 2 hr now

DOW day dot 18:55


DOW day bar 18:55


DOW 2 hr 18:57

DOW must close above 15.030 before 20:01 to challenge the high today. The falling 8 MA is the main R at 15.013

DOW 2 hr 8:47

SP500 is falling. 8 hr MA is down

SP500 2 hr 18:23

SP500 1 hr trend is down

SP500 1 hr 18:19

SP500 has broken 608

SP500 15 min 18:13

SP500 is trying to get an hourly close in 7 minutes above 613. Very exiting trading

SP500 1 hr 17:53

SP500 1 min chart says that the rally top has been seen. 613 broken on downside. 608 might be next target

SP500 1 min 17:30

SP500 1 min chart has to decide when rally top is in.

SP500 1 min 17:21

SP500 15 min with R lines in this fantastic robot rally

SP500 15 min 17:16

SP500 has got a sell cross between 8 and 21 MA and first question is if 608 will hold for the hourly close at 17:00

SP500 1 hr 16:52

SP500 has now taken 608. Next is 613 which might become more difficult


SP500 2 hr 16:41

SP500 daily chart has now got a double bottom at 600. Technically the trading can test the 620 today but so far there are R at 605, 608 and 613 to make that move

SP500 day 16:29

P500 has fallen from 620 down to 600 today. The trend is down. Now 604

SP500 15 min 16:20

10 yr notes day YIELD is up. now at 2.53


DAX trend is now down. See the broken H&S - head and shoulder - formation

DAX 30 min 15:38

DOW is falling and now R at 15.003.5. The uptrend might have seen its top. 15 min chart below at 15:32

SP500 target seems to be 603

SP500 15 min 15:25

sp500 is falling fast now 607

SP500 2 hr 15:20

SP500 2 hr trend is down and a new R on upside is 611.63

SP500 2 hr 14:55

SP500 has taken a new daily low.It now seems unlikely to get above 620 and even 618. If this is correct the trial to get above 618, the FIB 61,8 percent level is too difficult. That means that this rally only has been a strong correction, nothing else.

SP500 day 14:44

SP500 trading range so far 611 - 620. The FIB to close above is 618.

SP500 15 min 12:43

SWED has opened on upside and the aim must be to close the gap

SWED day 09:33


SWED 2 hr 09:33

EURO losing downside momentum.

EURO month 08:41


EURO week 08:41


EURO day 08:41

GOLD and SILVER new lows yesterday in the big bear markets

GOLD week 08:33


GOLD day 08:33


SILVER week 08:35


SILVER day 08:35

10 year notes day and week with very small corrections in the big down trends

10 year notes week 08:23


10 year notes day 08:23

NIK and HSI trends are up

HSI day 08:16


NIK day 08:16

DAX has opened at 8.005, a gap and is doing as the other indexes - trying take a new high today

DAX week 08:04


DAX day 08:04


DAX 2 hr 08:04

Today is the last day of the quarter, month and week so the indexes are trying to get as high closes as possible to make the weekly and monthly charts look strong and stable.


FTSE does the same as the SP500 and DOW trying to take a new high

FTSE week 07:47


FTSE day 07:47


FTSE 2 hr 07:48