28/02/2013

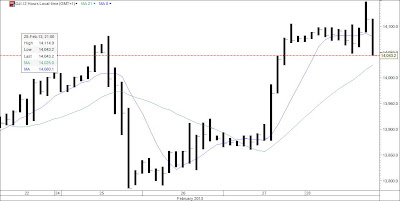
DOW closed down to the days low. 2 hr 8 MA has turned down. Thursday's close was 14.043.2

DOW 2 hr Thursday close

DOW trend still down

DOW 1 min 21:13

DOW unable to get above 14.142.7 turns on downside

DOW 1 min 20:35

SP500 trend is sideways

SP500 2 hr 17:59

DOW is moving sideways

DOW 2 hr 17:53

DOW rally could be just short covering so better be careful now

DOW 1 min 15:59

Dow rallies to test the high

DOW 2 hr 15:53

DOW trend is now down

DOW 15 min 15:22

DOW has broken S line at 14.069.1

DOW 5 min 14:34

All main indexes now. Why I follow the DOW so much is because it will show the way for all other indexes. Here you can compare the 90 days line diagrams.

DOW


SP500


NAS


FTSE


DAX


IBEX


SWED

Today Thursday lots of US economic news is coming at 14:30 that can move the markets. Today is the last fay of the month so the close is of interest for the big trend. Tomorrow March 1 the President will try to come to a solution about the costs for the government. These discussions will go on until 11:59 PM EST. Question is if market will react on the outcome Friday or wait until Monday.


DOW support line at 14.069.1 is holding well. A break below this S will probably trigger a strong fall. On upside the new high at 14.104.8 is the R line which if broken can take DOW to the last R point at 14.135 before the all time high at 14.193.5

DOW 15 min 11:57

DOW 2 hr 8 MA has only just crossed current bar so a sideways trend might continue

DOW day 10:36


DOW 2 hr 10:37

DOW seems to turn down soon

DOW 30 min 10:25

27/02/2013

DOW closed below R line at the bottom on 2 hr chart so this spike could have the new high at 14.104.8 as a difficult new top to take out

DOW day Wednesday close


DOW 2 hr Wednesday close.

Observe the close at the bottom which is called a spike indicating difficulties to take a new high


DOW close Wednesday at 14.073.1

DOW 1 min Wednesday close

DOW breaks bottom

DOW 1 min 21:52

DOW new top could be 14.104.8 which is high so far in 5 min chart

DOW 5 min 21:36

DOW last R point 14.135 before all time high at 14.194

DOW 1 min 21:26

DOW new high at 14.089

DOW 1 min 21:18

DOW might turn soon for profit taking

DOW 1 min 21:06

DOW high so far 14.076.7. Target top at 14.081.3

DOW 1 min 20:52

DOW closing in on the top

DOW 1 hr 20:45

DOW trend still up. High so far 14.002.5

DOW 15 min 17:43

DOW 1 min losing steam

DOW 1 min 16:49

DOW rallies above FIB 61.80 important R

DOW 1 hr 16:25

DOW rallies to new daily high on opening at 13.946.5

DOW 15 min 16:07

DOW 23 min before opening in US the index is in the middle of today's range

DOW day 15:06

DOW is slowly moving on upside probably to test the R line

DOW 1 hr 13:04

DAX looks vulnerable

DAX day 12:35

The 21 MA will continue to fall and 8 MA could easily turn down instead of crossing 21 MA this week.


DAX 2 hr 12:37

2 hr 8 MA is down and it is not far from bottom break

SWED closed below the long term channel Tuesday and has today taken a new low. This index use to show the way for next big movement in all the stock markets

SWED day 12:20

The index is also below its 21 day MA


SWED 2 hr 12:21

Very dangerous situation

DOW has hardly moved in Asia and Europe yet as you can see. 2 hr trend is sideways and might break on up or downside later today

DOW day 11:45


DOW 2 hr 11:46